Abstract
Summarize introduction through conclusion. Write this last.
Introduction
The City of Winters, in conjunction with the County of Solano, the California Department of Transportation (CalTrans), and the Federal Highway Administration (FHWA), is proposing to replace the Winters Road (Railroad Avenue) Bridge crossing Putah Creek. As part of the planning process, a Historical Resources Evaluation Report (HRER) was produced. Included in the HRER were maps produced by Sanborn-Perris in the late 1800s of the downtown Winters area.
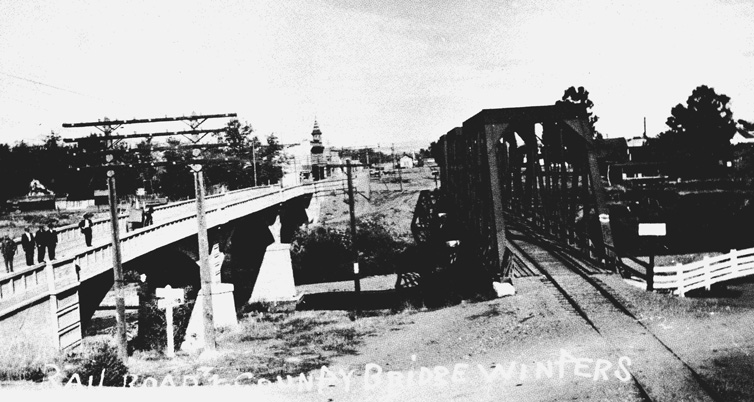 Winters Road Bridge (Railroave Avenue) is seen on the left. Photo credit: April 1, 1908, J. R. Chapman
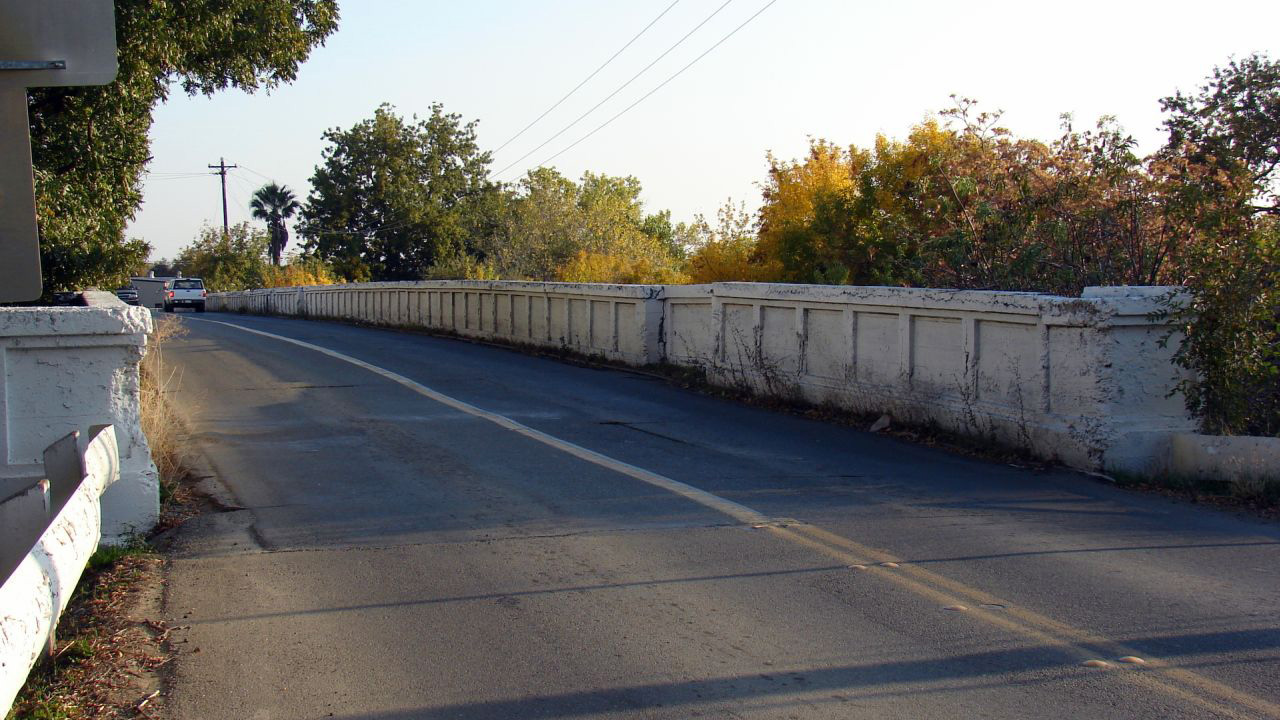 Winters Road Bridge (Railroave Avenue) as seen today. Photo credit: Paul Vineyard
In this same time period, the City of Winters is in development of a Form Based Code for the downtown area. A Form Based Code is a method of regulating development to achieve a specific urban form. This type of code creates a predictable public realm by controlling the physical form of development, with a lesser focus on land use. The City contracted with PMC, a consulting firm, to produce the documents, host meetings, and perform community outreach.
During this process, using photography, City documents and drawings, including sidewalk widths, street width to building height ratios, setbacks, lot coverage, floor area ratio, building widths, building heights, frontage types, sign types, residential density, storefront types and parking locations were noted and cataloged for use in developing the Code. Average lot sizes, placement and building frontages were of particular interest as a starting point for future infill development in the downtown.
The maps and reports produced originally for the Railroad Avenue Bridge construction now became of use for the Form Based Code development. Two maps were of particular interest in determining historical lot sizes and placement. Originally used for Fire Insurance, the Sanborn-Perris maps provided a historical look at the parcel dimensions of the City of Winters for the years 1891-1893.
 The Sanborn collection includes some fifty thousand editions of fire insurance maps comprising an estimated seven hundred thousand individual sheets. (photo credit: UC Berkeley)
The Sanborn-Perris maps would need to be scanned and digitized, in order to compare the current parcel layout to those of the 1891 and 1893 maps. As a final step, a conceptual map would be prepared showing parcel layout for a proposed multiple-block project using historical data as a foundation.
Background
By comparing various maps, map users try to understand how maps were made and to assess their reliability. We investigate the reliability of the spatial context of historical maps by measuring the accuracy of the drawings. Comparing historical maps with modern data is a practical way of investigating. To enable such comparisons we consider disparities between sources that are the result of real physical changes and differences due to the techniques used to produce paper maps. This must result in a method that objectively describes how to interpret and compare features on historical maps with the same (and sometimes no longer existing) elements on reliable modern maps. (J. Benavides, E. Koster, 2006)
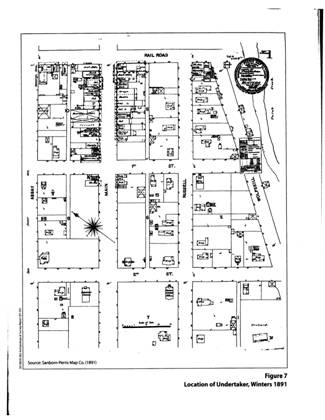
Sanborn-Perris Map Co. (1891) Sanborn maps were lithographically printed in the company's Pelham, New York, plant. With the aid of waxed paper stencils, Sanborn employees colored the maps by hand, not visible on the reproductions.
The Sanborn-Perris maps were of fairly good quality, reproduced on 8.5”x11” sheets of paper. The street configuration and block layout of downtown Winters has been relatively unchanged since 1891. The maps scale was unreadable, and a lot of unreadable parcel notes were provided. The loss of quality at duplication of the maps contributed to the poor quality of text, I was disappointed. I wanted to know if collectors and historians were taking steps to provide high resolution images of historic maps to the general public.
David Rumsey amid items from his map, atlas, and globe collection, which he is making available online. (Photo credit: davidrumsey.com)
David Rumsey of davidrumsey.com has dedicated over two years of work and a lifetime of map collecting to selecting, digitizing and posting over 2,300 historical map images to his website. His cataloging techniques included a map’s standard information as well as the map’s cartographic relevance- scanning the maps at sometimes as high as 600dpi. Rumsey is encouraged about the future of historic maps. The very existence of high-resolution copies of maps on the web will bring these beautiful and important materials to the attention of the general public in ways that have not been possible before. (Julie Sweetkind, 2000)
In addition to teaching geographic understanding, historical maps do an excellent job of illustrating change over time. They personalize history by giving evidence of familiar landmarks and of people, their beliefs, and the political policies of an era. (Library of Congress – Zoom Into Maps, 2004)
Methods
The first step in preparation for digitizing the Sanborn-Perris maps was to scan the paper documents at 600dpt, the highest resolution possible at my workstation. This did not improve the quality of the document, but preserved it at basically its current state. I explored the scanned map at higher magnifications to try to decipher some of the unreadable text, and was able to decipher some interesting features. I could identify the locations of orchards, wells, churches, stables, dwellings, and saloons. Parcel lines were sometimes ambiguous, only noted by a thin black line, a line that was also used to outline building footprints. Most parcels were unaffected by this, but some zero-lot-line parcel boundaries were presumably affected.

Step one of heads-up digitizing, Georeferencing
I began digitizing the maps using a heads-up digitizing method, rubber-sheeting the image in place, using current block and street layout to fit the image into place. My first impression was how similar the street and block layout was, and also, how similar the majority of the parcel dimensions are to current parcels. Changes have occurred since 1891, but the majority of downtown Winters parcel structure remains unchanged.
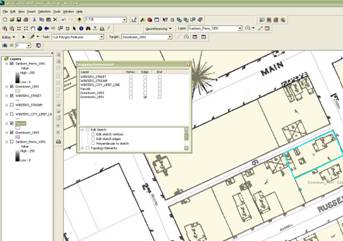
Step two of digitizing, cutting polygon features
The downtown section between First and Railroad along Main Street still contains the same zero-lot-line buildings it did in 1891, allowing little room for parcel changes. The farther away from that downtown core, the more parcel changes have been made. Home sites are now commercial buildings; orchards have been subdivided into residential neighborhoods. I noted a natural expansion of the commercial and retail downtown, and an intensification of the residential uses directly adjacent to that commercial area.
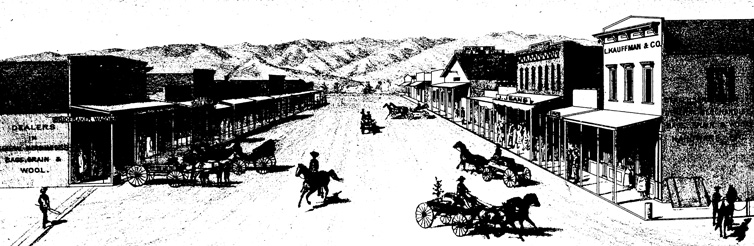 Downtown Winters looking West at Railroad Avenue and Main Street. Illustration credit: DePue & Co., 1879
 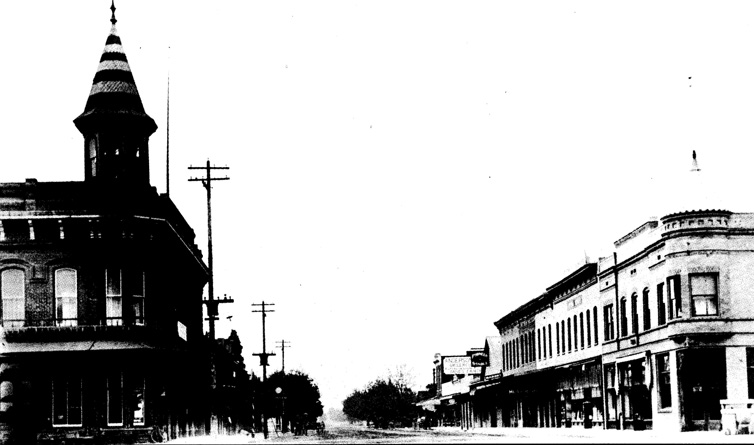 Downtown Winters looking West at Railroad Avenue and Main Street. Photo credit: 1908, unknown photographer as part of the Winters Historical Collection, L. and G. Leggett.
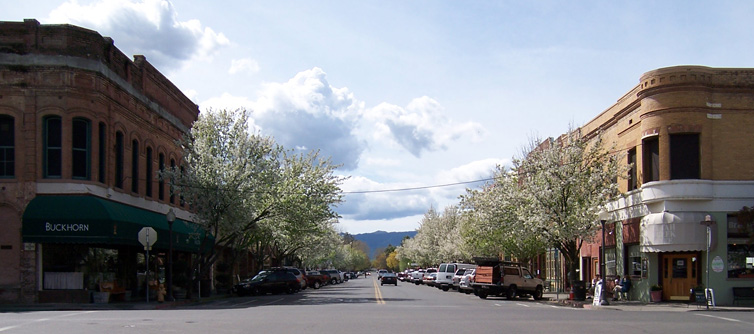 Downtown Winters looking West at Railroad Avenue and Main Street. Photo credit: 2008, Jen Michaelis
A third step in the process was to provide statistical information from the historical map’s parcel structure and from the same section of the modern parcel structure.
Finally, I prepared a conceptual map of parcel features for a currently undeveloped section of the downtown using the historic parcel sizes and arrangement to illustrate what a development layout may look like using historic planning as a starting point.
Results
1891 Statistics
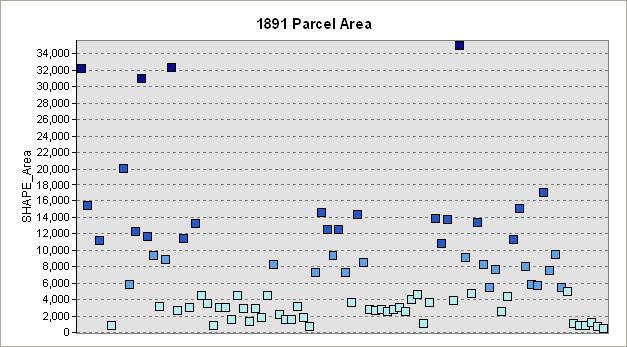
Historic parcels varied in size from 483 square feet to 35,027 square feet, however most parcels fell between 483 square feet and 13,636 square feet.
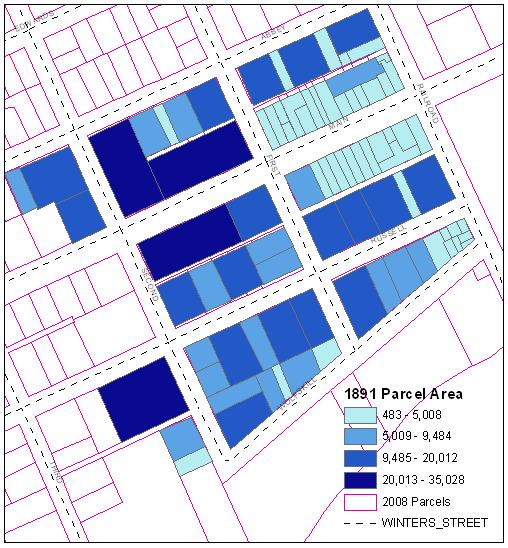 Historic Parcel Size, 1891
Examining the downtown core along Main Street from Railroad Ave to First Street from the 1891 map, parcel frontages were generally from 20 feet to 50 feet, interspersed with slightly narrower and slightly wider frontages. The parcel areas for just this section were between 785 square feet and 8,640 square feet.
2008 Statistics
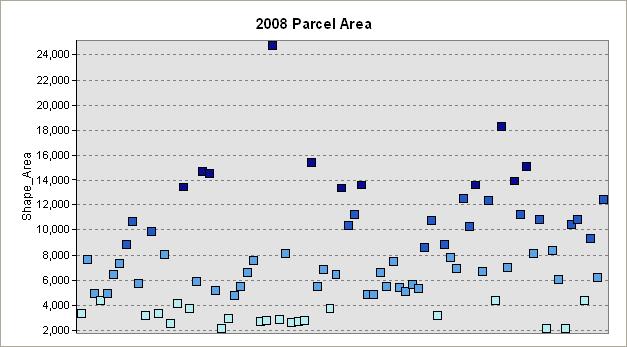
In 2008, parcel sizes range from 2,150 square feet to 24,755 square feet, however most parcels are between 2,150 square feet and 10,800 square feet.
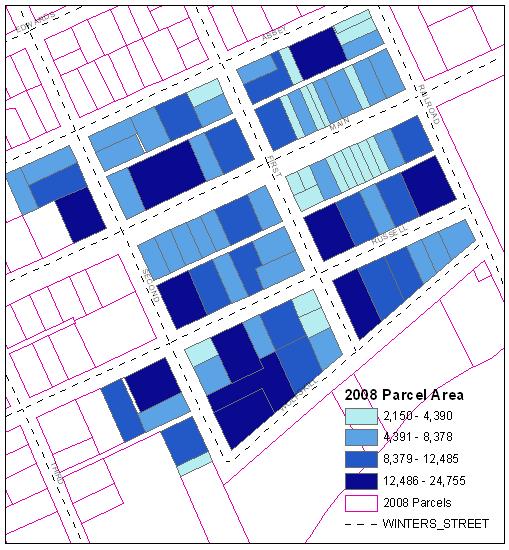 Modern parcel size, 2008
Examining the downtown core along Main Street from Railroad Ave to First Street from modern maps, parcel frontages were generally from 16 feet to 80 feet, interspersed with slightly narrower frontages. The parcel areas for this section were between 3,309 square feet and 9,307 square feet.
Analysis
The conceptual development area is a parcel aproximately 17,710 square feet in size, divided into varying sized frontages or storefronts and open courtyard areas ranging between aproximately 1,200 square feet to 5,500 square feet.
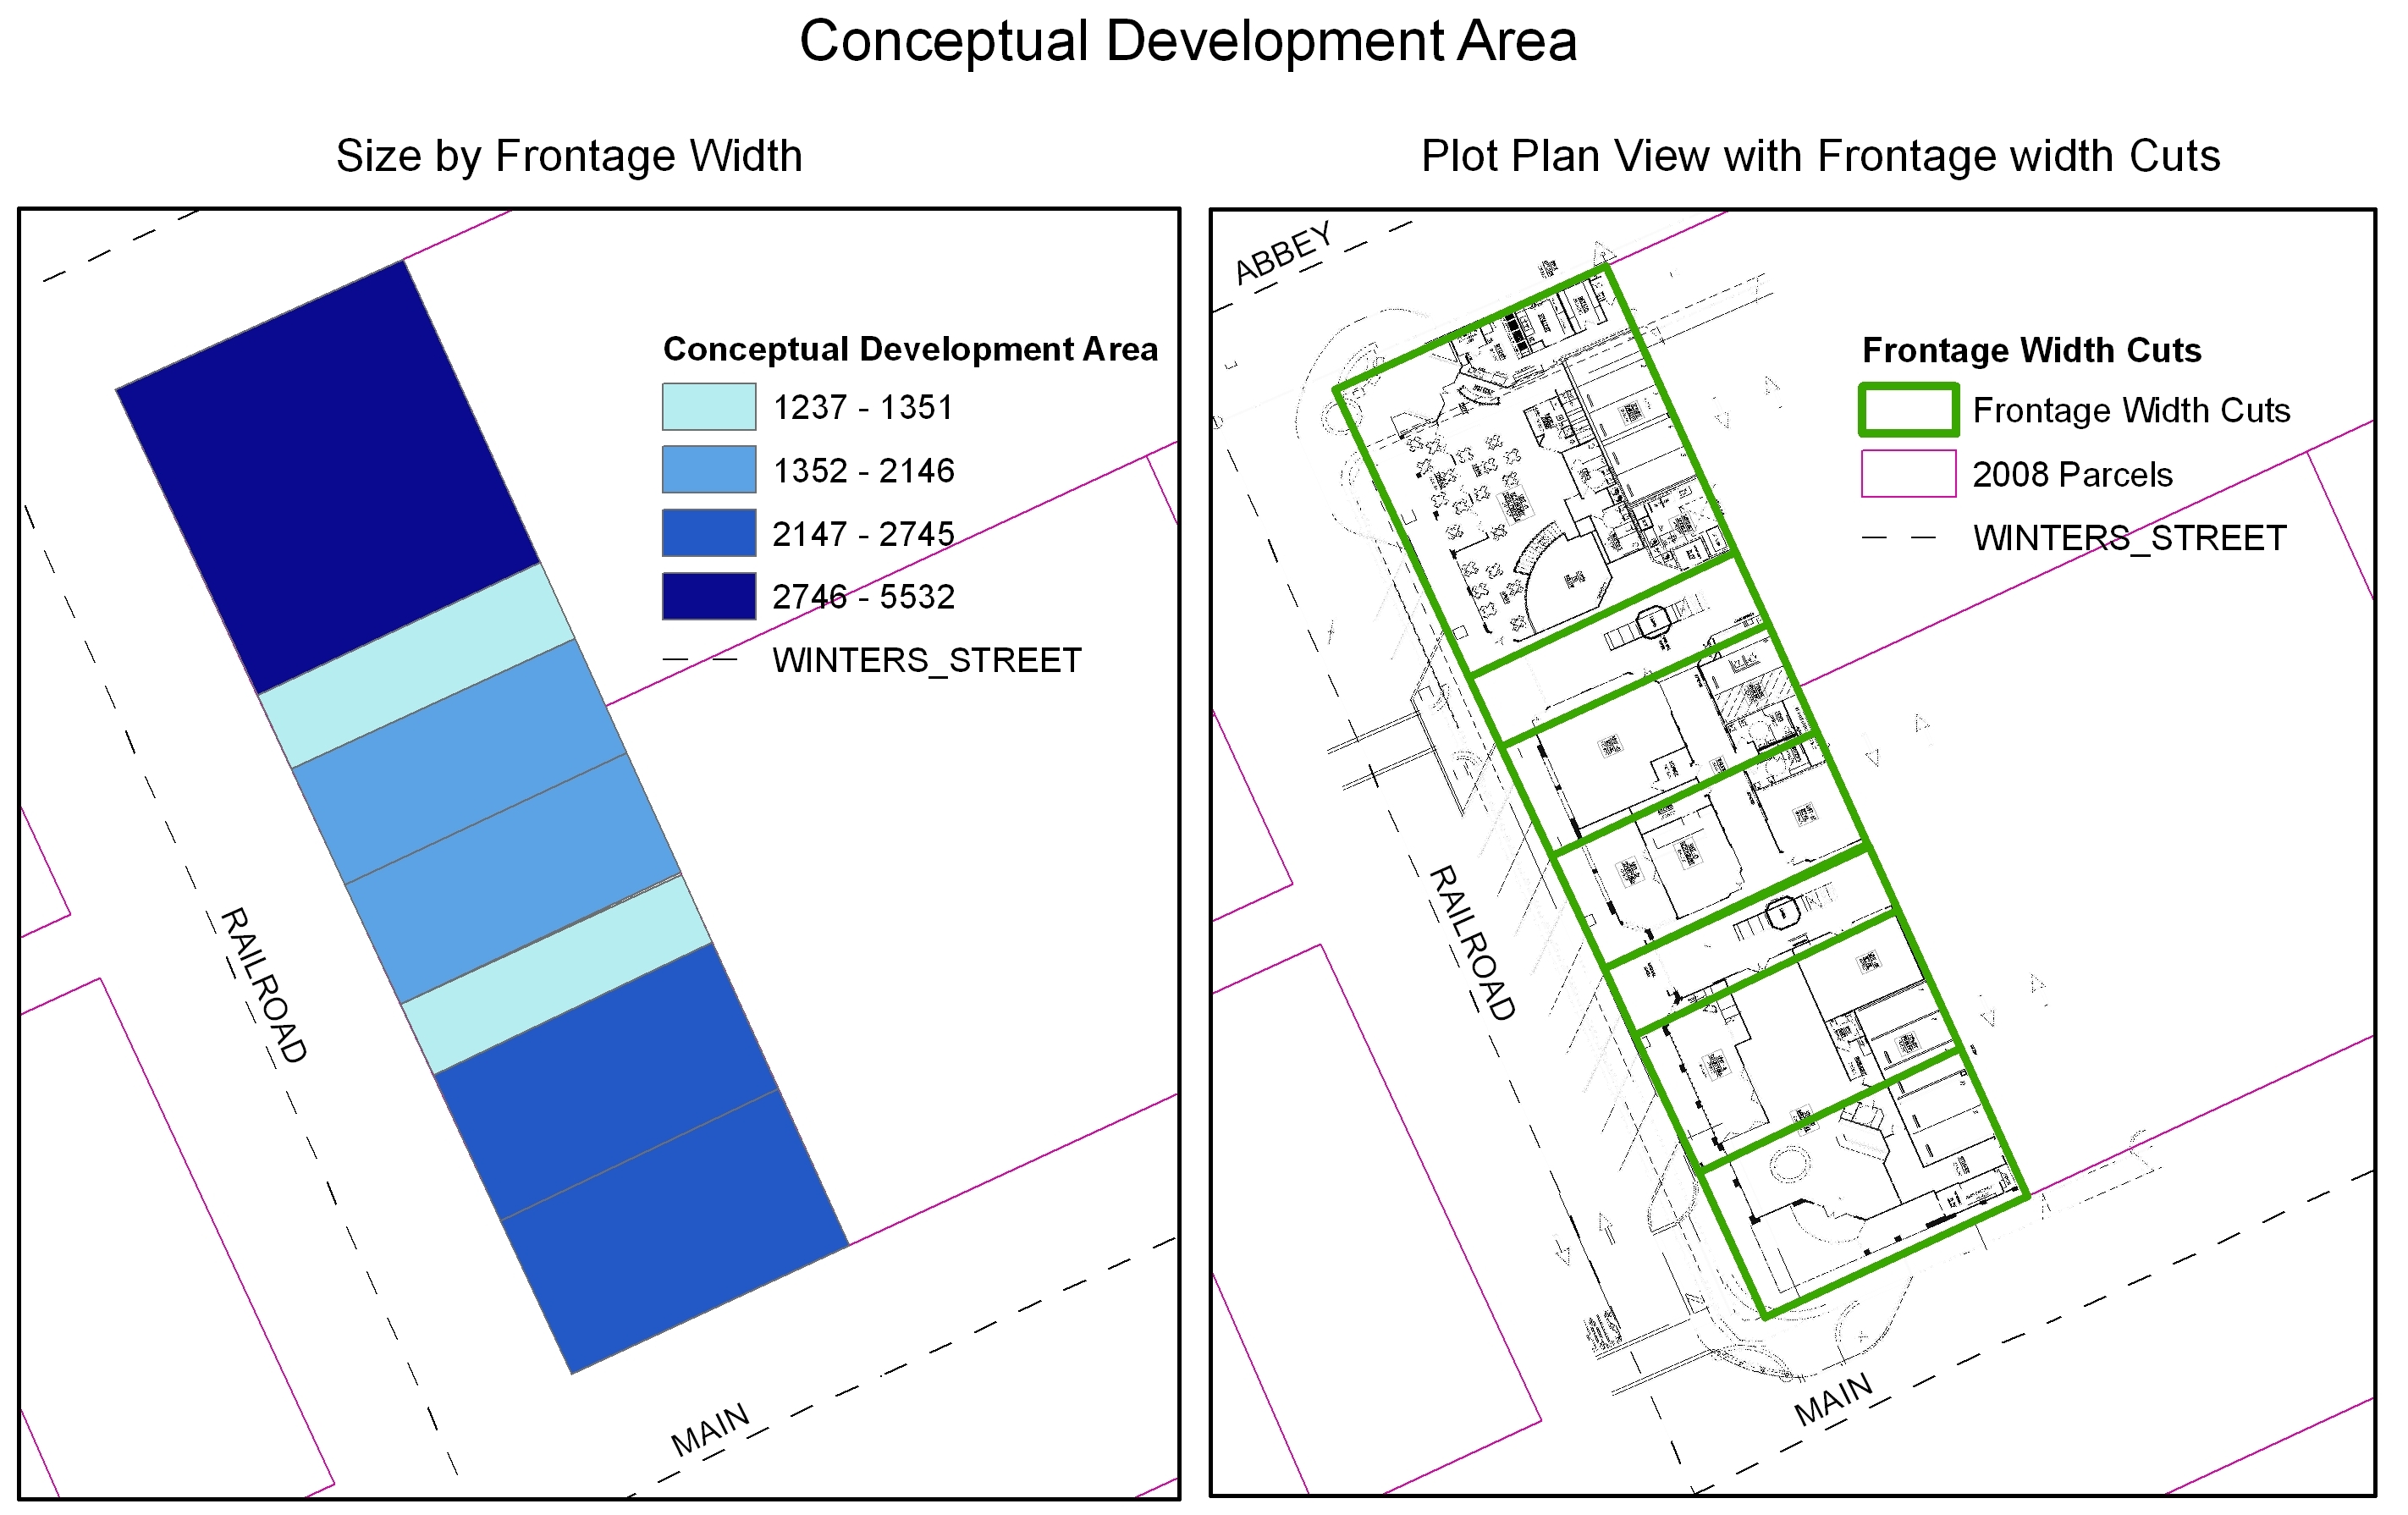 I cut the parcel using the storefront or frontage widths into component peices.
The component peices of the development are between 80 feet and 20 feet in frontage width, with smaller lot square footages due to the short depth of the parcel in comparison with the significantly deeper neighboring downtown parcels.
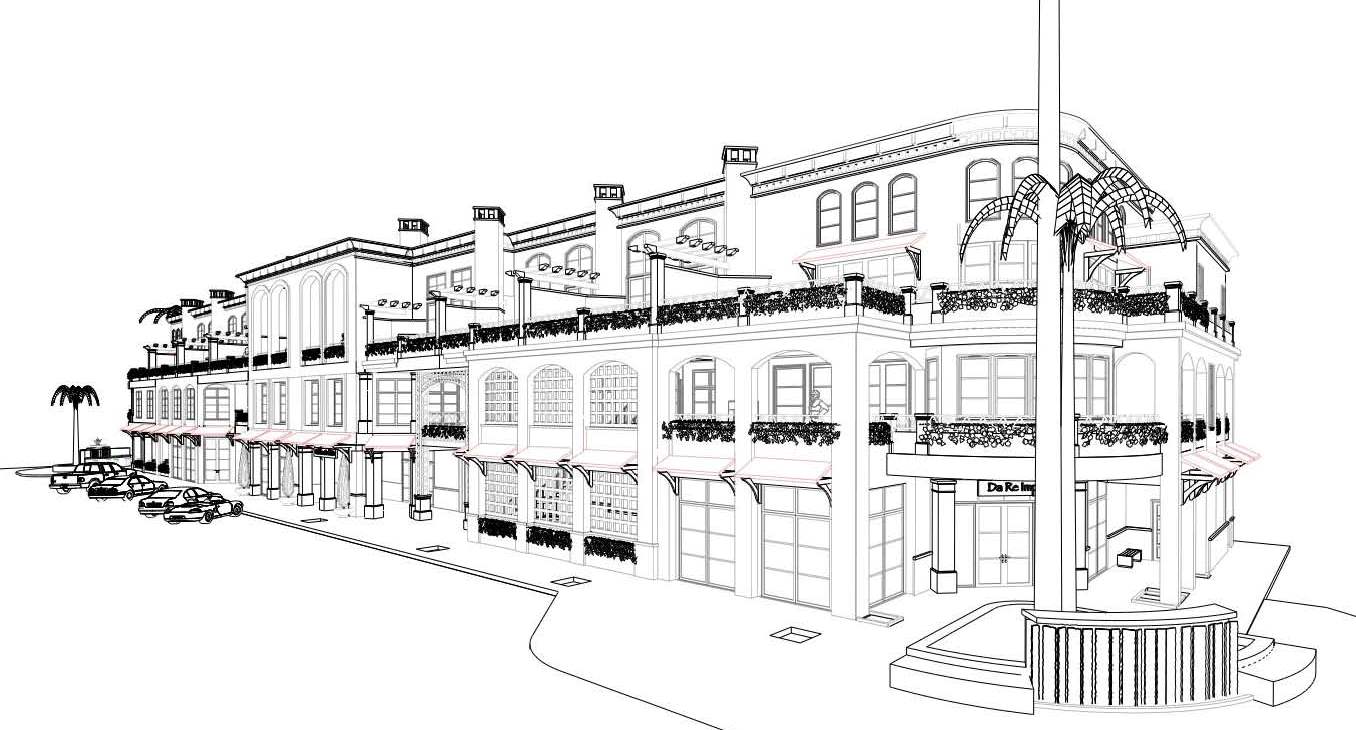
Conceptual Development at Railroad & Main Street
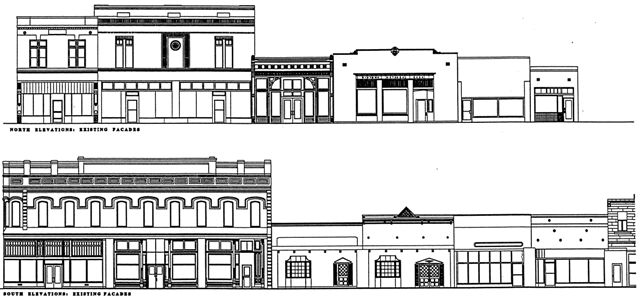 Current Facades on Main Street between FIrst and Railroad
Conclusion
The average square footages of the conceptual development are significantly smaller than those of the 1891 maps and of the current downtown parcel struture, the individual storefront widths are generally within historic norms. However, considering the smallest "storefront widths" contain mostly open courtyard area and are not obvious architectural features, I would reccomend after this analyss, to include other smaller storefront areas in the development.
References
Jones & Stokes. 2008. Historical Resources Evaluation Report, Winters Road (Railroad Avenue) Bridge Replacement Project. January. (J&S 05738.05) Sacramento, CA. Prepared for MGE Engineering, Inc. and the California Department of Transportation, Central California Environmental Branch, District 4, Oakland CA.
“What can be learned from historic maps?” Library of Congress Geography & Map Division. 2/29/08. 6/7/04. <http://memory.loc.gov/learn/features/maps/introduction.html>
Identifying surviving landmarks on historical maps, J. Benavides and E. Koster ISSN 1790-3769, e-Perimetron, Vol. 1, No. 3, Summer 2006 [194-208]
State of the Art. Julie Sweetkind, Mercator’s World Magazine, September/October 2000.
“Sanborn Fire Insurance Maps” UC Berkeley Library. 3/18/08. 12/15/03. <http://www.lib.berkeley.edu/EART/snb-intr.html>